
Per-stage performance — started, completed, planned against actual, how often a stage ran long, short or on time. Delays counted by cause, crew on-time rates, photo coverage. And a timeline of every change to the plan itself: renames, length changes, checkpoints added or removed, and who did it. Every average states how many jobs it is built from.
Also called: stage performance · which stages run over · crew performance · how long does framing really take
How long framing actually takes you, measured on your own jobs
Started, completed, average planned against average actual, and how often a stage ran long, short or on time. After a season, the number you put on a 40×60 shop stops being the estimator's memory and starts being your own history. Every average states how many jobs it is built from, because an average over two stages is not the same claim as one over forty.
Every quote uses the same guess for post set, the guess is two days short, and nobody notices because nobody measures it.
The estimator quotes the next 40×60 off what your crews actually did, not what he remembers. Quoting from your own history is how a builder stops losing money on the same stage every job.
Nobody can move the goalposts mid-build
What you said a stage would take is locked when the job starts. Where it sits on the calendar stays free to move, so a slipping job can be re-plotted without quietly making itself look on time. Before that lock existed, changing a stage from five days to seven mid-build rewrote the estimate every planned-against-actual number reads from.
A stage gets stretched from five days to seven mid-build, and the report then says it finished on time.
The owner gets an honest late-or-on-time number because the promise is locked the day the job starts. Crews are judged against what was actually promised, which is fair to them and useful to you.
Delays carry a cause and a day count, so they add up to an answer
Marking a stage delayed opens one form: cause — weather, crew no-show, material issue, equipment, permit delay, site access, scope change, other — days or hours lost, what happened, and photos. Nothing is written until you save, which is why the rows are complete enough to total. The version before this wrote a row the moment you tapped a cause, and most of them ended up recording that a delay happened for an unknown number of days for no stated reason.
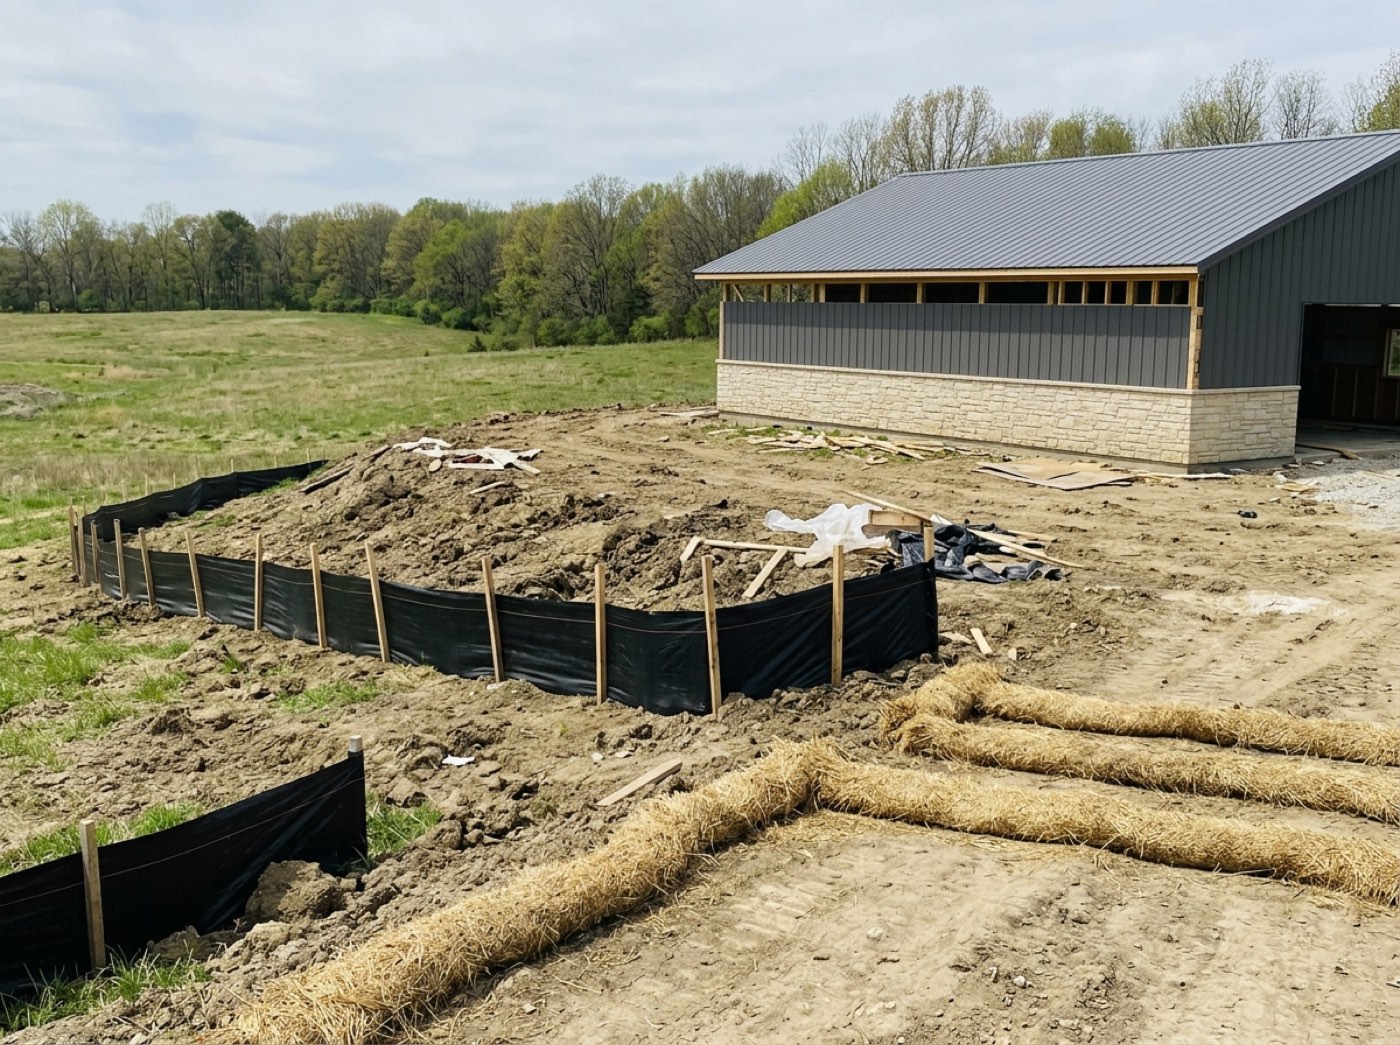
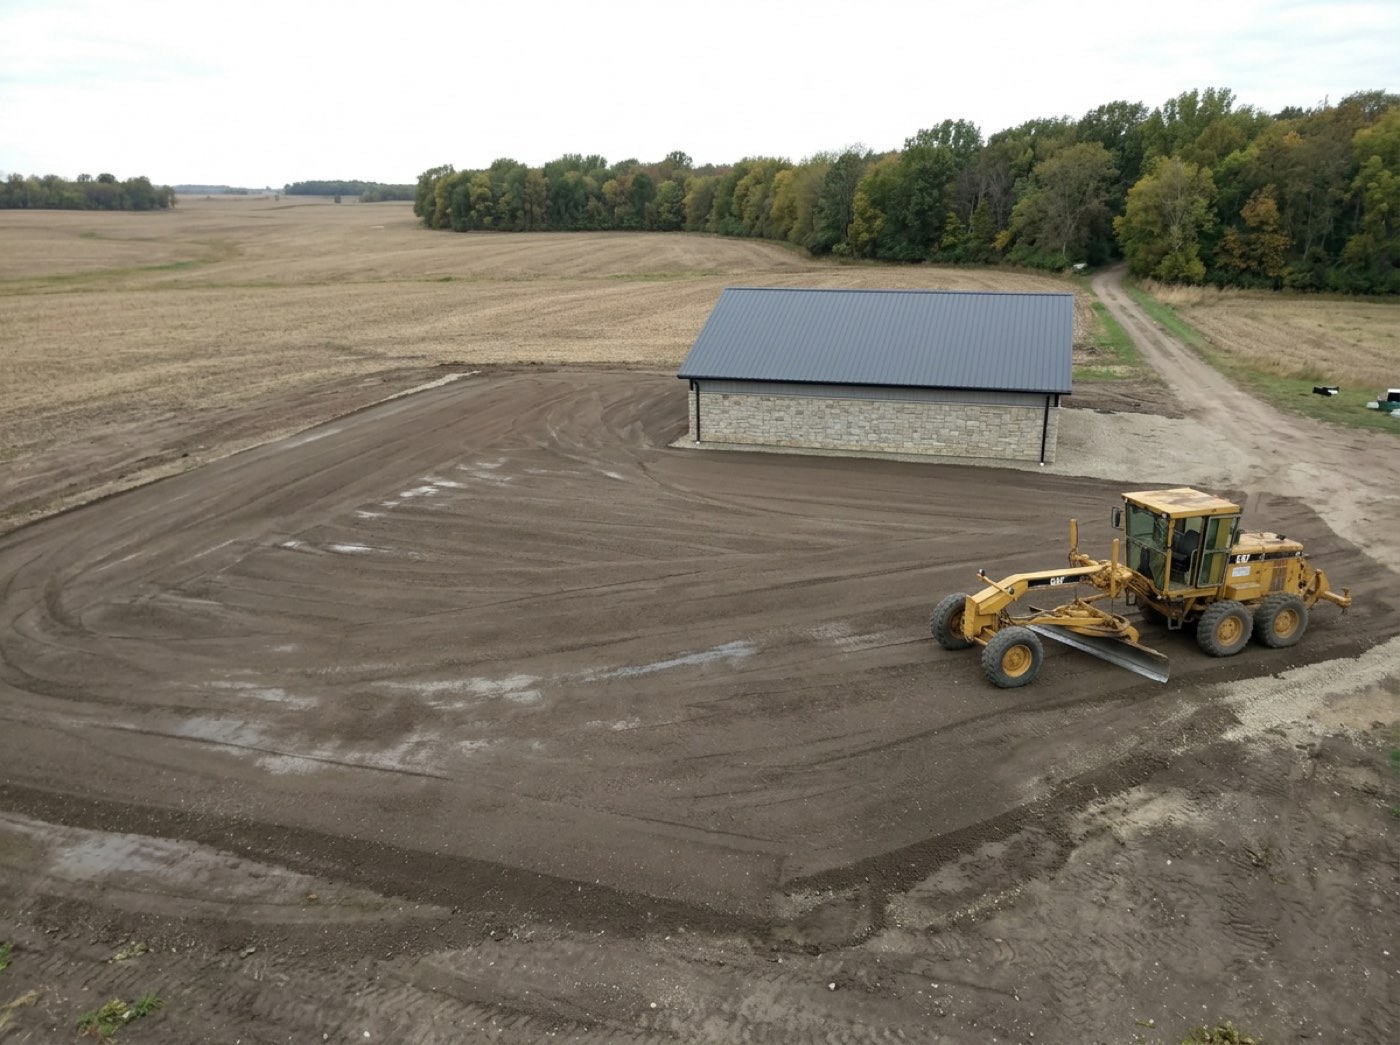
Half the delays on record have no cause and no day count, so the yearly review is a pile of "delayed" with nothing to add up.
The project manager can finally say which cause is costing the most days, because every delay is saved with a cause and a number. Countable delays are the ones you can actually fix.
"We got slower" and "somebody cut the estimate" look identical in one number
So both are kept: every rename, length change, colour change, reorder and checkpoint added or removed is logged with the person who made it, and shown on the same timeline as the performance. A stage that suddenly runs two days over may simply have had two days taken off its plan last month, and you can see that in one place.
Framing suddenly reads two days late, the crew gets the blame, and nobody remembers the estimate was cut by two days last month.
The owner can tell "the crew got slower" from "someone cut the estimate" before making a call about the crew. Fair calls about people keep good men from walking.
Days off plan, by stage
Every stage plotted as the gap between the plan and what happened — not how long it took, but how far off it was.
Jobs run late and nobody can say which part is the problem, because the only number anyone keeps is the finish date. The stage that quietly eats four days on every build never gets named.
The owner sees which stage keeps eating promised days, rather than just that jobs finish late. Naming the stage is the first step to fixing it.
What actually cost you the days
Lost days ranked by reason — weather, materials, access, inspection, crew — from the days your own crews logged as they lost them.
Lost days get written off as weather because weather is the reason nobody argues with, so the delays you could actually fix never surface as a pattern.
The project manager can push back on "it was the weather" with a ranked list of what really cost the days. A third of it often turns out to be a delivery someone could have chased.
Only work you actually tracked goes into the averages
The numbers are built from the stages your crews worked and logged here. A job you brought in mid-build has its earlier stages recorded as finished before tracking started, with no dates, so they add nothing to the averages. Nothing is back-filled to make a stage look measured when it wasn't.
Back-filled stage lengths from old jobs sneak into the averages, and the next quote is built on numbers nobody actually measured.
The owner can trust an average because it holds only real, watched work — no invented lengths from jobs that started before you switched. Trustworthy numbers are the only ones worth quoting from.
- 1Open Settings → Project Stages → Analytics.
- 2Pick a window — 30 days out to 2 years.
- 3Read planned against actual for every stage.
- 4Read days lost by cause, and by crew.
- 5See plan changes on the same timeline as the performance.
A stage that suddenly runs two days over might have had its estimate cut by two days last month, and one number cannot tell those apart — so builders were making decisions about crews using figures that were really recording their own edits. Sample sizes are shown too: an average over two stages is not the same claim as one over forty, and a leaderboard that hides the difference invites exactly the wrong call about who to keep.
- No measured stage durations to estimate from
- Performance changes indistinguishable from estimate changes
- Averages presented without their sample size
Stage analytics
Under Settings, Project Stages, Analytics, over anything from 30 days to two years. Four totals across the top, then a row per stage with runs, average planned, average actual, days off plan, ran-long versus ran-short, days lost and photos. Underneath: where the time went, a crew table, who documented the work, and every edit you have made to your stage setup.
Who changed the plan, and when
A running list of what changed on your stage templates: the stage, what kind of change it was, the old value and the new one, who did it and when. It also shows the stages that get changed most.